


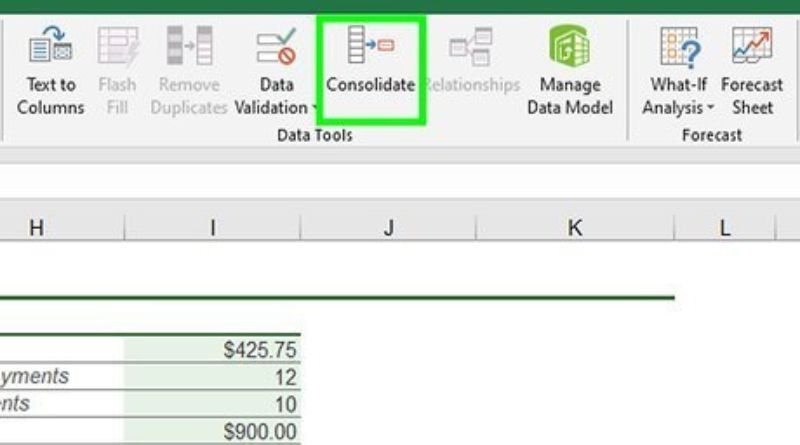
How to Use Data Consolidation to Create Summary Reports in Excel
Data consolidation is an Excel skill that you’ll use time and time again when working with large data sets. It can also be one of the most confusing Excel skills to learn if you’re new to it, as it involves manipulating text and figures that aren’t always easy to see or understand at first glance. Fortunately, this guide will show you how to use data consolidation in Excel to make summary reports so that your data becomes easier to read and understand than ever before!
Step 1: Prepare Your Data Set
- Locate your data set, open it up and make sure you have the necessary headings for your report. You may need to do some pre-processing such as adding row numbers or removing unnecessary columns. Once you are ready, save the file as a .csv (comma separated values) file.
- In Excel, click on Data and select Get External Data. On the right hand side of the screen, find your CSV file and select it – then click OK.
- Your spreadsheet should now be populated with all of the information from your original data set.
Step 2: Customize Your Worksheet Layout
Decide how you want your summary report to look by customizing the worksheet layout. Select the column headings and row labels that represent your data set, then select a style for the table cells. The style options available depend on what type of data is being summarized, such as numbers or text. For example, if you are summarizing text data, you can choose a style that makes it easier to read.
Step 3: Create Conditional Formatting Rules
- To create the conditional formatting rules for each number, select the range of cells you want to apply the rule too, right-click and choose Format Cells.
- On the Conditional Formatting tab, click Add New Rule > Top/Bottom Rules > Top 10 Items, then select a color you would like your top ten items to appear in.
- Repeat these steps by clicking on Bottom 10 Items > and selecting a different color for your bottom ten items.
- If you’re not happy with how it looks or if your top ten items are more than 10 just add another rule for Top 11 – 20 Items and so on until you reach your desired amount of top items that will be listed in green text.
Step 4: Add Sum Functions
- Highlight the cells that you want to sum together. You can either click on each cell individually or click and drag over them with your mouse.
- Click on the Sum button on the toolbar at the top of the screen.
- The bottom section of the screen will change and display a number for each column and row highlighted, which is called Sum of. Click on this field, type in a name for your summary report, and press Enter.
Step 5: Review the Report Card Report
- Look for discrepancies between the number of students with a specific grade and the total number of students. – Check to make sure that your calculations are adding up correctly. If not, recalculate your numbers. – Compare your report card information with national averages and grade-level benchmarks if you have them available. – Review the report card summary table and add a few sentences about what you learned from looking at this data.
- In order to get a high school diploma, it takes an average of 3.5 years (4 semesters) in public schools or 2 years (2 semesters) in private schools.